1. Market Size and End-Use Composition
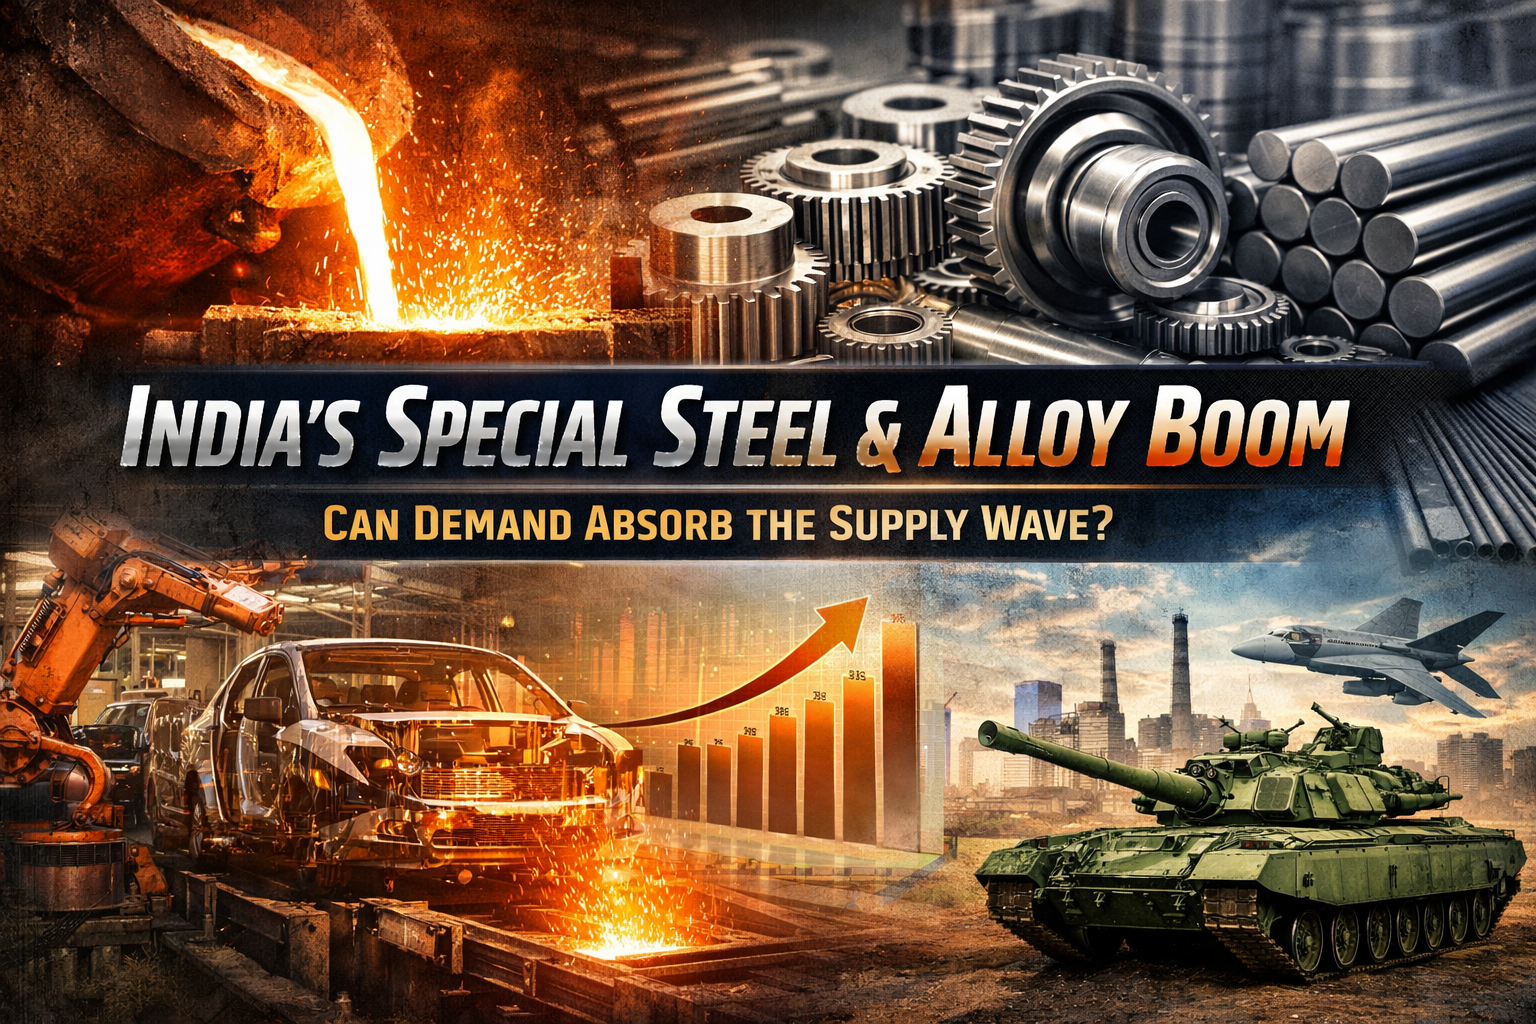
India’s special and alloy steel consumption is currently estimated at 19 to 22 million tonnes annually, accounting for approximately 13 percent of total finished steel demand.
End-use distribution is approximately:
- Automotive: 38 to 42 percent
- Capital goods & engineering: 18 to 22 percent
- Infrastructure & construction (high tensile applications): 10 to 12 percent
- Oil & gas and energy equipment: 8 to 10 percent
- Defence & railways: 7 to 9 percent
- Bearings, tools and miscellaneous: balance
Automotive therefore remains the dominant demand anchor. Passenger vehicles and commercial vehicles together consume a large share of alloy long products and forged grades. India’s auto production is projected to grow at 5 to 7 percent CAGR, while EV penetration could reach 15 to 20 percent of new sales by FY30, increasing demand for high grade motor and shaft steels.
Assuming 6 to 8 percent annual growth in aggregate special steel consumption, demand could reach 25 to 28 million tonnes by FY30.
2. Announced Capacity Additions
Over the last two to three quarters, announced specialty and alloy capacity additions are estimated at 1.5 to 2.0 million tonnes, excluding longer-term integrated expansions.
Notable additions include:
- Heat-treated plate capacity expanded to 0.7 million tonnes annually.
- New alloy EAF-based capacity of approximately 0.5 million tonnes in northern India.
- Ferrochrome expansion from 0.26 million tonnes to ~0.4 million tonnes, increasing alloy input availability by roughly 50 percent.
Including indirect integrated expansions targeting value-added mix improvement, effective specialty supply capability could increase by 2.5 to 3.0 million tonnes over three years.
3. Capacity vs Demand Projection (FY26–FY30)
| Year | Estimated Demand (MT) | Effective Capacity (MT) | Utilisation % (Base Case) |
|---|---|---|---|
| FY26 | 20.0 | 23.5 | 85% |
| FY27 | 21.3 | 25.0 | 85% |
| FY28 | 22.7 | 26.5 | 86% |
| FY29 | 24.3 | 27.5 | 88% |
| FY30 | 26.0 | 29.0 | 90% |
Base case assumes 6.5 percent demand CAGR and phased ramp up of new facilities.
Under this trajectory, announced capacity is absorbable without structural overcapacity. However, if demand growth slows to 4 percent CAGR, FY28 utilisation could fall below 80 percent, materially impacting EBITDA.
4. EBITDA Differential vs Commodity Steel
Commodity flat steel EBITDA per tonne over the cycle typically fluctuates between ₹3,000 to ₹7,000 per tonne, depending on pricing environment.
Special and alloy steel EBITDA typically ranges between ₹6,000 to ₹12,000 per tonne, depending on grade complexity and customer integration.
A shift of 5 percent of total product mix toward specialty steel in a 20 million tonne integrated producer could improve blended EBITDA margin by 80 to 120 basis points, assuming stable demand.
This margin enhancement explains the current capex push toward alloy diversification.
5. Raw Material Cost Structure and Ferro Alloy Linkage
Special steel production cost includes:
- Base steel billet input
- Ferro alloys (manganese, chromium, molybdenum)
- Heat treatment and finishing costs
Ferro alloys can account for 8 to 15 percent of total specialty steel production cost, depending on grade. Expansion of domestic ferrochrome capacity reduces import dependence and cost volatility, enhancing margin control for stainless and alloy producers.
Backward integration into ferro alloys therefore provides structural competitive advantage.
6. Export Exposure and Competitive Risk
India exports an estimated 20 to 25 percent of its specialty and alloy steel output. Key markets include Southeast Asia, the Middle East and select European segments.
Competitive pressure remains significant:
- China in mid-grade alloy categories
- Japan and South Korea in premium automotive grades
- Europe in bearing and tool steels
If global industrial growth moderates, export absorption may weaken. A 10 percent decline in export volumes could reduce overall utilisation by 2 to 3 percentage points, pressuring margins.
7. Utilisation Sensitivity Analysis
At utilisation above 85 percent, specialty steel plants typically sustain strong margin realisation due to fixed cost absorption.
Below 80 percent utilisation, EBITDA per tonne can compress by 15 to 25 percent, depending on cost structure.
Therefore, ramp-up sequencing and customer onboarding discipline are critical. Aggressive capacity commissioning without secured offtake contracts increases volatility risk.
8. Strategic Assessment
India’s special steel expansion aligns with industrial growth and import substitution ambitions. Under a 6 to 8 percent demand growth scenario, announced capacity is structurally absorbable through FY30.
The key risk is timing mismatch between ramp up and qualification cycles, not long term demand collapse.
Producers combining scale, OEM integration, backward alloy linkage and product mix discipline are best positioned to sustain margin resilience.
Conclusion
India’s special steel capacity boom is economically rational under base case demand growth assumptions. The segment offers materially higher EBITDA potential than commodity steel and enhances earnings quality.
However, utilisation discipline and export competitiveness will determine whether this expansion cycle strengthens margins or temporarily dilutes them.
The next three years will test execution more than ambition.